
Free Cash Flow Under the Microscope
Evidence from 238 non-GAAP cash flow metrics and 562 reconciling adjustments reveals where S&P 500 companies diverge in their free cash flow presentations.

Why is Meta’s free cash flow definition different from Alphabet’s? Why does Amazon calculate free cash flow differently from Oracle?
Free cash flow (FCF) has become one of the most closely watched metrics as companies invest billions in AI infrastructure. Yet, despite the SEC’s “typical” FCF definition, there is no standard way to calculate it. I analyzed the population of S&P 500 companies to see how companies actually define free cash flow - and where comparability begins to break down.
Key findings:
Most companies keep free cash flow definitions simple. More than half companies with FCF metrics make just one adjustment, usually centered around capital expenditures.
The devil is in the details. Companies don't always mean the same thing by "capital expenditures" and sometimes layer on their own company-specific adjustments.
Adjustments matter. While capital expenditures adjustment usually decreases GAAP cash from operations in FCF calculations, custom adjustments may substantially increase the reported FCF metrics.
Background
Free cash flow (FCF) is a commonly used non-GAAP measure. While free cash flow is not defined in GAAP, SEC C&DIs observe that the metric is “typically calculated” as GAAP operating cash flow less capital expenditures:
“Some companies present a measure of “free cash flow,” which is typically calculated as cash flows from operating activities as presented in the statement of cash flows under GAAP, less capital expenditures.
Investors often use free cash flow to gauge a company’s financial health. Free cash flow measures the amount of cash available for distribution to shareholders, debt repayment, or acquisitions. However, FCF should not be characterized as discretionary cash flow, because some non-CAPEX costs, such as interest expense or deferred compensation, are not discretionary.
I have previously written about the SEC’s scrutiny of free cash flow disclosures, including comment letters addressing companies’ presentations of the metric and a prohibition on characterizing it as cash available for discretionary spending. Frequent SEC comments illustrate that, despite the seemingly straightforward “typical” definition, questions about how companies calculate and present free cash flow metrics continue to arise in practice.

That raises a broader question. How closely do public companies adhere to the SEC’s “typical” definition? How often do they make non-CAPEX adjustments to arrive at FCF and Adjusted FCF numbers? And when companies refer to “capital expenditures,” what expenditures do they include?
Descriptive Statistics
To answer these questions, I examined free cash flow reconciliations furnished on Form 8-K Item 2.02 by S&P 500 companies between January and March of 2026.
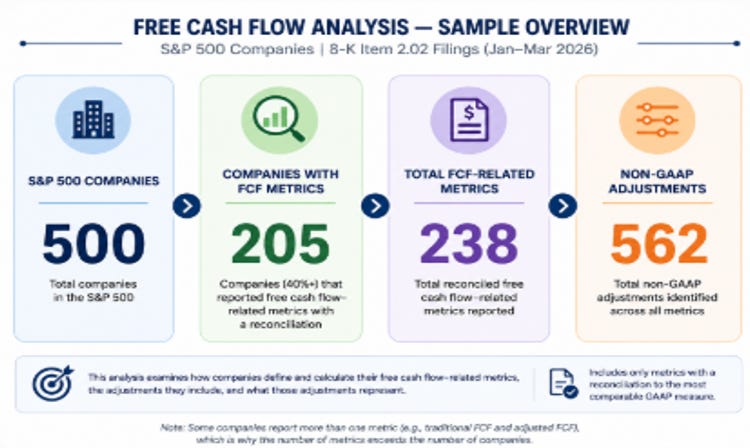
The final sample comprises 205 companies - slightly more than 40% of the S&P 500 - that reported 238 non-GAAP cash flow-related metrics. The number of metrics exceeds the number of companies because some issuers reported multiple measures, such as both a traditional and an adjusted cash flow metric.
Across those 238 reconciliations, I identified 562 reconciling adjustments used to bridge GAAP cash flows from operating activities to the non-GAAP free cash flow metric. These adjustments include capital expenditures as well as other less common items, such as restructuring costs, acquisition-related items, litigation settlements, and other company-specific adjustments.
The results suggest that while many companies continue to anchor free cash flow in the traditional formula of operating cash flow less capital expenditures, there is meaningful variation in how companies report capital expenditures and in the additional adjustments they incorporate into the metric.
The analysis includes only reconciled metrics. A small number of companies discussed free cash flow in the narrative portion of their earnings releases but did not provide a reconciliation. Those disclosures were excluded from the analysis.
How Companies Define Free Cash Flow
One question I was interested in was how closely companies adhere to the traditional free cash flow formula: “operating cash flow less capital expenditures.” One way to assess this is to examine the number of line items in the FCF non-GAAP reconciliation table.
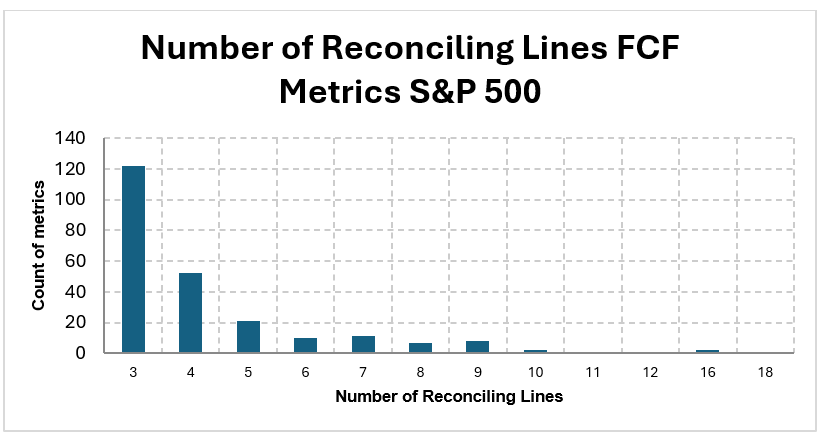
Figure 1 – Number of Reconciling Lines in Free Cash Flow Tables
Source: SEC filings, analysis by Deep Quarry.
Each reconciliation table includes both the starting GAAP line - typically cash flows from operating activities - and the ending non-GAAP measure, such as free cash flow or an adjusted free cash flow metric. As a result, a reconciliation table with three items contains only one reconciling adjustment between the GAAP and non-GAAP measures.
As shown in Figure 1, simplicity rather than complexity is the norm. More than half of the non-GAAP metrics (122 metrics, or 51% of the total 238 metrics identified) include only three items, suggesting that companies make only one adjustment to arrive at free cash flow. In most cases, I classified that adjustment as capital expenditures, consistent with the SEC’s observation that free cash flow is “typically calculated” as cash flows from operating activities less capital expenditures.
Although companies use different labels, such as “Capital expenditures,” “Purchases of property, plant and equipment,” or “Additions to property, plant and equipment”, these adjustments generally refer to the same underlying concept of investing in long-term PPE assets. Therefore, I grouped these adjustments into a single capital expenditures category for this analysis.
Yet, similar does not equate to identical. Some companies broaden the capital expenditures adjustments by including items such as capitalized software (e.g., Verizon) or leasehold improvements (e.g., Seagate Technology Holdings). As a result, two companies may both report a single “capital expenditures” adjustment while capturing somewhat different cash outflows.
The next most common FCF presentation consists of four lines (52 metrics, or 22% of the sample), suggesting two reconciling adjustments. Many of these metrics remain centered on capital expenditures but present the adjustment on a more disaggregated basis. For example, companies often report “Capital expenditures” or “Purchases of property and equipment” together with a separate line for “Proceeds from sale (or disposal) of property, plant, and equipment,” effectively presenting net capital expenditures through separate inflow and outflow components.
Another relatively common adjustment is related to capitalized software development costs (for example, MCKESSON CORP presents a separate line for capitalized software expenditures along with payments for PPE).
Adjustments to Reconcile Free Cash Flow Metrics
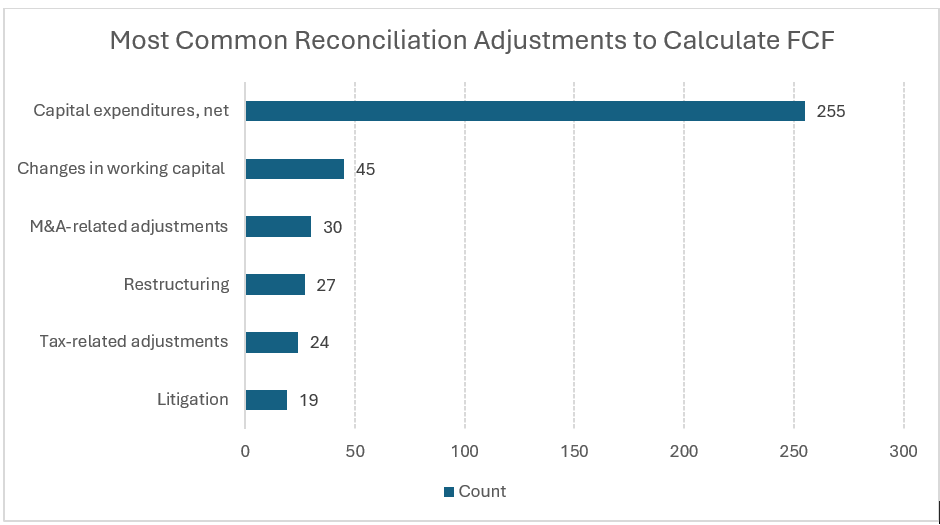
Figure 2 classifies the 562 individual reconciling adjustments identified across the sample into broad categories.
Figure 2 – Most Common Adjustments to Arrive at Free Cash Flow
Source: SEC filings, analysis by Deep Quarry.
Capital expenditure-related adjustments dominate the landscape, accounting for 255 adjustments, or approximately 45% of all reconciling items. For this analysis, I broadly classify capital expenditure adjustments to include not only traditional capital expenditures and purchases of property, plant and equipment, but also items such as proceeds from asset dispositions, and capitalized software costs. Even under this broad classification, more than half of the reconciling adjustments are unrelated to capital expenditures.
The second most common group of adjustments is related to changes in working capital (45 adjustments), followed by M&A-related adjustments (30), restructuring-related items (27), tax-related adjustments (24), and adjustments related to litigation settlements (19). The results suggest that while capital expenditures remain the foundation of most free cash flow calculations, companies frequently incorporate additional company-specific adjustments that can affect the comparability of the reported metric.
Limitations of Free Cash Flow Metrics
The descriptive statistics above explain how companies calculate free cash flow. They do not, however, eliminate the metric’s inherent limitations. Francine McKenna and I discussed the limitations of the free cash flow metrics in detail in our piece about the deteriorating free cash flow of large data center operators (often referred to as hyperscalers).

As the SEC has cautioned in its comment letters, free cash flow should not be interpreted as cash available for discretionary spending because it excludes many non-discretionary cash obligations. Francine McKenna has similarly noted in her 2017 Market Watch piece that positive free cash flow does not necessarily imply that management has unrestricted cash available for dividends, share repurchases, or acquisitions, particularly when companies face significant contractual commitments such as debt service, taxes, or other required cash payments:
“The problem is “free cash flow” does not have a universal definition and its title does not describe how it is calculated. Companies should be careful, the SEC wrote in May 2016, to avoid “inappropriate or potentially misleading inferences” about the usefulness of any free cash flow metric.
For example, “free cash flow should not be used in a manner that inappropriately implies that the measure represents the residual cash flow available for discretionary expenditures,” according to the guidelines.”
These limitations become particularly relevant for companies investing heavily in AI infrastructure. As discussed in our earlier analysis, traditional free cash flow metrics may not capture significant commitments such leases that have been signed but have not yet commenced. Jonathan Weil, in a February 23. 2026, WSJ piece, has also argued that, for companies such as Meta, reported free cash flow can overstate economic cash generation because it excludes substantial cash outflows associated with stock-based compensation, including tax withholding payments and share repurchases used to offset employee equity dilution.
The descriptive statistics are consistent with the argument about limitations of reported free cash flow metrics. Of the 562 reconciling adjustments identified in the sample, those related to deferred or equity compensation are rare. Likewise, only six companies, including Meta and Intel, present separate lease-related adjustments, three of which relate to payments on financing leases. Two additional companies include lease-related items in the capital expenditures line.
The absence of a GAAP definition leaves companies with substantial leeway in calculating their free cash flow metrics, reducing comparability. Lease-related adjustments are a good example: while Meta includes principal payments on finance leases in its free cash flow calculation, Amazon, Alphabet, and Oracle do not.
The Direction and Magnitude of Free Cash Flow Adjustments
One feature distinguishes free cash flow from most other non-GAAP metrics. Recent research by Calcbench found that 89% of S&P 500 companies reporting non-GAAP earnings presented a measure that exceeded the corresponding GAAP result. In other words, most non-GAAP earnings adjustments increase reported performance:
“Among the 351 firms we identified as reporting non-GAAP numbers, 89 percent reported non-GAAP adjustments that led to higher earnings compared to GAAP net income.”
Free cash flow tells a different story. In my sample, 217 of the 238 cash flow-related non-GAAP metrics (about 91%) were lower than their corresponding GAAP measures. The negative GAAP/non-GAAP difference reflects the CAPEX-centered nature of the adjustments – typically, capital expenditures reduce cash from operations to arrive at the FCF number.
What is consistent with Calcbench’s non-GAAP EPS analysis, however, is that company-specific adjustments, such as litigation settlements and M&A-related payments, often increase free cash flow metrics. Let’s look at an example.
Let’s look at an example of Coca-Cola, which shows how companies frequently build on the traditional free cash flow framework by introducing company-specific adjustments.
Figure 3 – Coca-Cola’s Free Cash Flow Presentation FY2025, $ million
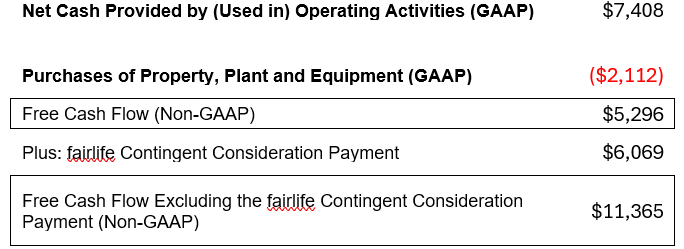
Source: Coca-Cola’s 8-K Item 2.02 filed on EDGAR on February 10, 2026.
Coca-Cola first reports a conventional free cash flow metric equal to cash provided by operating activities less purchases of property, plant, and equipment. It then presents a second measure - Free Cash Flow Excluding the fairlife Contingent Consideration Payment - that adds back the $6.1 billion cash payment made in 2025 to settle the contingent consideration associated with its 2020 acquisition of fairlife (emphasis added):
“In 2025, the Company recorded other operating charges of $1,261 million. These charges consisted of $960 million related to the impairment of our BodyArmor trademark, $97 million related to the Company’s productivity and reinvestment program, and $47 million related to the remeasurement of our contingent consideration liability to fair value in conjunction with our acquisition of fairlife in 2020, which brought the total liability to $6,173 million and was paid in March 2025.”
Unlike capital expenditures, the payment reflects an acquisition-specific obligation rather than ongoing investment in the business. Excluding the payment more than doubles the free cash flow number, from $5.3 billion to $11.4 billion, demonstrating how company-specific adjustments can materially affect the “typical” FCF metric.
Coca-Cola’s fairlife adjustment is not the first example of a company-specific cash flow materially affecting Coca-Cola’s free cash flow metrics. In 2024, the company presented Free Cash Flow Excluding the IRS Tax Litigation Deposit, adding back the approximately $6 billion deposit made to the U.S. Treasury while appealing the Tax Court’s transfer pricing decision.
Figure 4 – Coca-Cola’s Free Cash Flow Presentation FY2024
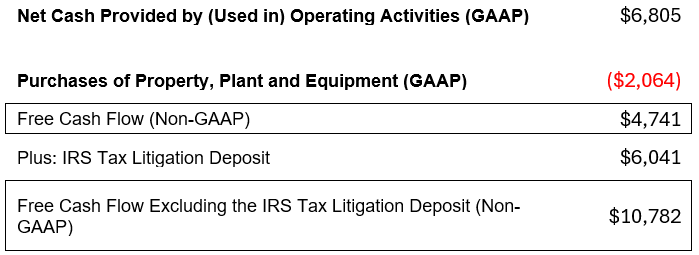
Source: Coca-Cola’s 8-K Item 2.02 filed on EDGAR on February 11, 2025.
The dispute centers on the IRS’s claim that Coca-Cola understated its U.S. taxable income by allocating too much profits to foreign affiliates under its long-standing transfer pricing methodology for trademarks and other intellectual property. After losing in the Tax Court, Coca-Cola deposited approximately $6 billion in taxes and interest while appealing the decision, a payment that halted the accrual of additional interest and would be refunded, with interest, if the company ultimately prevails.

A loss, however, would be detrimental for the company. As reported by Bloomberg:
“A loss in this case would have major consequences for the soft drink company’s finances. Coca-Cola has already paid the IRS $6 billion, although it would get that money back if a court overturns its lower court losses. If the Eleventh Circuit rules in favor of the IRS, the company has told investors it might need to pay up to an additional $14 billion, though it has only set aside about $520 million.”
The presentation also raises an interesting consistency question. Suppose Coca-Cola ultimately prevails and the Treasury returns the deposit. In this case, the resulting cash inflow would increase operating cash flow. Applying the same logic used in 2024 would suggest that the refund should likewise be excluded from the adjusted free cash flow metric. Otherwise, the metric would exclude the cash outflow when the deposit was made but include the economically identical cash inflow when the deposit is returned, making the metric misleading.
Coca-Cola is one of a handful of companies with an adjusted free cash flow figure exceeding the corresponding GAAP cash from operating activities. Most companies that report positive adjustments—such as restructuring, litigation, or acquisition-related payments—still report free cash flow below operating cash flow because those adjustments only partially offset capital expenditure deductions.
This article focuses on the high-level descriptive statistics. The underlying company-level data, including 238 reconciled free cash flow metrics, the classification of 562 individual reconciling adjustments, and the supporting observations used throughout this analysis, is available to premium subscribers upon request.
For questions and data inquiries, please contact olga@deepquarry.com.
Investment, Tax and Legal Disclaimer: This article is for informational purposes only and does not constitute investment, tax or legal advice. The content contained herein is not to be relied upon as the basis for any investment or other decision. Nothing herein should be construed as a solicitation, recommendation, endorsement, or offer to buy or sell any particular security, product, or service. The author has not taken into account the specific investment objectives, financial situation, or particular needs of any specific person who may read this material. Investing involves inherent risks, and there can be no guarantee that any investment or company mentioned will be suitable or profitable for any investor’s investment portfolio. Readers are strongly advised to conduct their own thorough research and consult with a qualified and licensed financial professional and legal counsel before making any investment decisions. Past performance is not indicative of future results.
Free cash flow should be adjusted to account for variations in AR and AP.
Delaying the payment of bills until after quarter end doesn't provide discretionary cash, but the extra payables end up in free cash flow.
Great Read, Thanks Olga!